
Agent Scorecard Metrics for Recruiters: Ready Weights, Fast Rollout
- donnylee532
- 11 minutes ago
- 7 min read

Agent scorecard metrics are a compact set of performance and activity KPIs, lead response time, lead-to-appointment rate, appointment-to-listing conversion, listings taken and closed, activity index, listing-to-sales ratio, and cost-per-closing, reviewed weekly for leading indicators and monthly for lagging ones. These are the numbers that separate a coachable slow start from a genuine hiring mismatch.
TL;DR:
Prioritize tracking lead response time, appointment-to-listing conversion, and activity index in the first 30 days to catch early performance issues.
Focus on lead response time under five minutes, and aim for at least a 30% appointment-to-listing conversion rate across both seller and buyer metrics.
Use transaction-level metrics like listing-to-sale price ratio and days on market against the local median to assess pricing skill accurately.
Build scorecards gradually, starting with three high-signal KPIs, and adjust weights according to whether coaching new or experienced agents.
Implement automation for data collection to ensure accuracy, and review lead KPIs weekly to catch dips before they impact results.
Table of Contents
What Do Agent Scorecard Metrics Actually Measure?
A scorecard only works if each metric answers a distinct question about how an agent works, not just how much they close. Recruiters who lean solely on gross commission income (GCI) get the story after the money has already been won or lost. Leading indicators tell you why before the closing ever happens.
Lead response time measures how fast an agent replies to a new inquiry, and it’s the single most controllable variable in the entire pipeline. A five-minute reply and a two-hour reply are not the same lead anymore; the second one has usually called someone else. This is the metric response time differences can multiply conversion most, and it’s the cheapest one to fix through automation.
Lead-to-appointment rate and appointment-to-listing conversion track two separate skills. The first measures whether an agent can turn interest into a face-to-face or video meeting. The second measures whether they can turn that meeting into a signed listing or a buyer commitment. Seller-side conversion tends to hinge on pricing conviction and market knowledge; buyer-side conversion hinges more on patience and needs discovery, so treat them as different coaching problems even when the raw numbers look similar.
Listings taken, pending, and closed form a natural funnel. Listings taken is leading, it shows current momentum. Pending and closed are lagging, they confirm whether that momentum turned into revenue.
The core numbers to track together:
Lead response time (minutes to first contact)
Lead-to-appointment rate and appointment-to-listing conversion
Listings taken, listings pending, listings closed
Listing-to-sales ratio and list-to-sale price ratio
Agent activity index (call, follow-ups, showings logged per week)
The listing-to-sales ratio and list-to-sale price ratio reveal pricing skill more than any other pair of numbers. An agent who takes ten listings and closes only two isn’t lacking leads, they’re likely overpricing to win the listing appointment. Transaction-level metrics like list-to-sale price ratio and days on market against the local median give you a far more predictive read than reviews or referral counts ever will.
The agent activity index rolls up calls made, follow-ups completed, and showings logged into one number, and it’s your earliest warning system. An agent whose activity index drops for two straight weeks will show a conversion drop a month later. Catch it here first.
How Do You Build and Weight a Real Estate Scorecard?
Don’t launch all seven metrics on day one. Adoption fails when agents feel buried under a dashboard they don’t understand yet.
Start with three high-signal KPIs for 30 days: lead response time, appointment-to-listing conversion, and the activity index. These three alone catch most performance problems early, and top teams built around a seven-KPI dashboard still treat these three as the foundation.
Expand to the full seven-metric view once agents are comfortable checking their own numbers, adding listing-to-sales ratio, listings taken, GCI, and cost-per-closing.
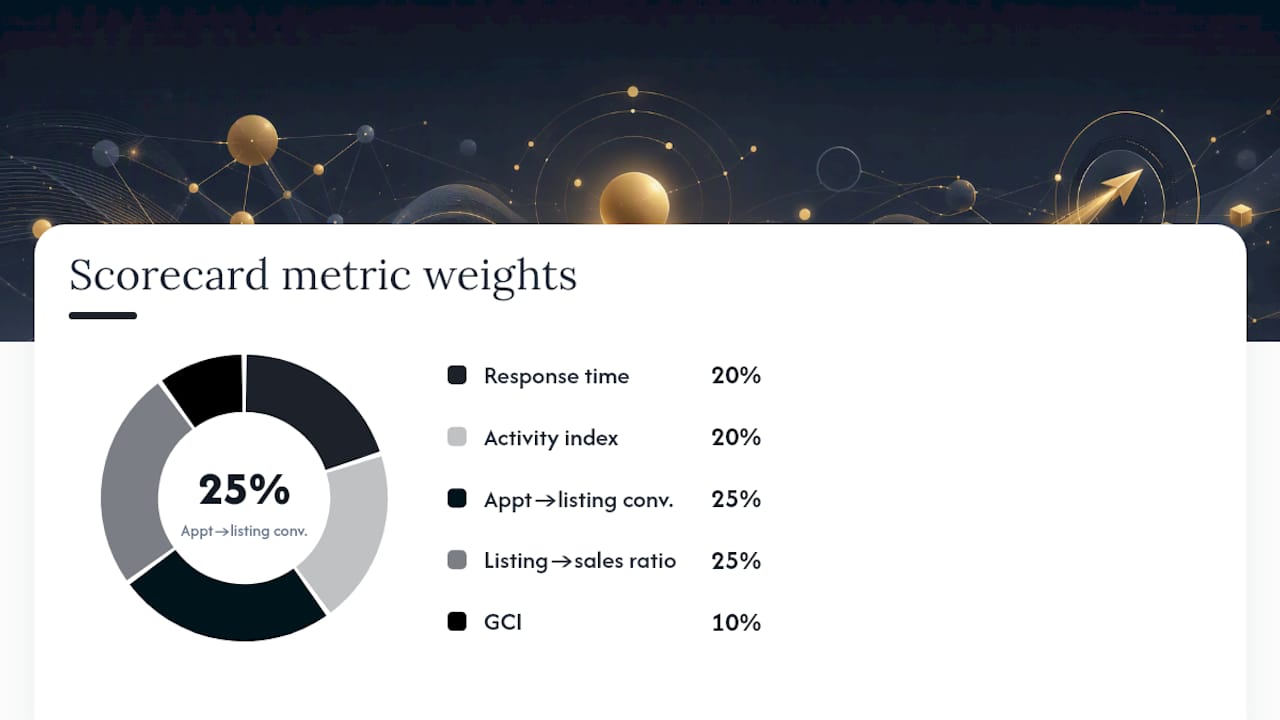
Weight the metrics by what you’re trying to solve. A simple illustrative formula: response time and activity index at 20% each (they’re controllable and predictive), appointment-to-listing conversion at 25%, listing-to-sales ratio at 25%, and GCI at 10%. Adjust weights to match whether you’re coaching new agents (weight activity higher) or veteran producers (weight conversion and price ratio higher).
Set green, amber, and red thresholds for each metric so a coaching conversation triggers automatically rather than waiting for a bad quarter to become obvious.
Roll the pilot out with one team of five to eight agents before pushing it agency-wide. Run it for a full 60 days, review leading KPIs every week and lagging KPIs once a month, and adjust the weighting once before you scale it.
Pro Tip: Don’t score cost-per-closing until you have at least three months of clean lead-source data. An agent penalized for a bad number that’s really a bad data feed will stop trusting the whole scorecard.
What Data Sources Feed an Accurate Agent Dashboard?
A scorecard is only as honest as the data behind it, and manual logging is where most scorecards quietly die. If entering a follow-up call takes an agent ninety seconds of typing, most agents skip it, and your activity index becomes fiction.
Map your CRM fields to the KPI definitions before you touch a dashboard: timestamp of first inbound contact, timestamp of first agent reply, pipeline stage changes, and a logged activity type for every call, text, and showing. Automating first-response capture instead of relying on agents to self-report is the single change that fixes the most data-quality problems, since it removes the incentive to round a forty-minute response down to “quick.”
Good dashboard design usually separates into three layers:
A team leaderboard for weekly standups, ranking agents on leading indicators only
An individual dashboard each agent can see for their own numbers, updated daily
A funnel or time-in-stage view showing where leads stall between contact and appointment
Weekly standups paired with individual dashboard access have been shown to cut average response times from hours down to minutes, largely because agents self-correct once they see their own lag next to a teammate’s. Be transparent about what’s shared publicly (team leaderboard) versus what stays private (individual coaching notes), and tell agents exactly why each number is being tracked before you turn the dashboard on.
What Benchmarks Signal a Coaching Problem?
Numbers without a target are just noise. Here’s where most brokerages set the bar, adjusted to your local market where you can:
Lead response time: under 5 minutes for inbound digital leads
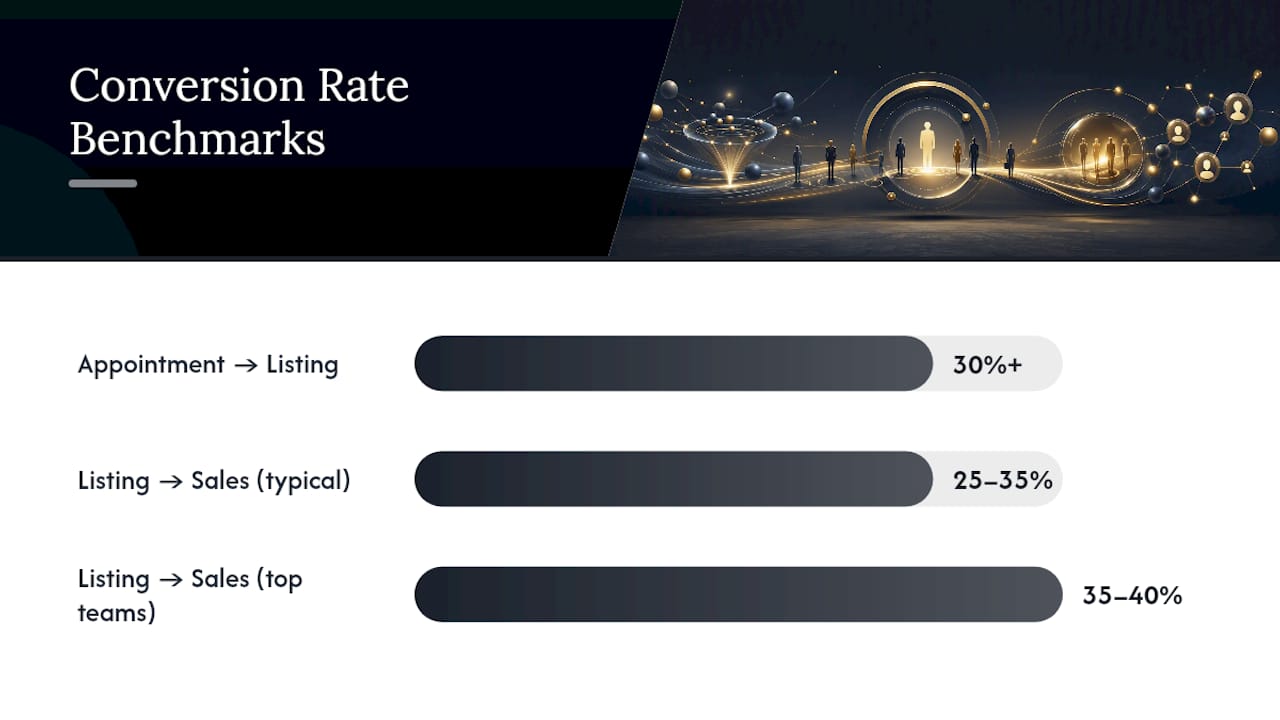
Appointment-to-listing conversion: 30% or higher
Listing-to-sales ratio: 25% to 35% is typical, with top teams hitting 35–40%
A two-month consecutive decline in any leading KPI should trigger a coaching conversation automatically, don’t wait for the lagging numbers to confirm what the leading ones already told you.
When a metric slips, run a short diagnostic before assuming the agent is the problem: is it pricing skill (listing-to-sales ratio low but activity high), follow-up consistency (activity index dropping), or lead quality (appointment rate fine but listing conversion poor across the whole team, not just one agent)? Benchmarks work best measured against the local median rather than a national number that may not reflect your market’s pace.
Pro Tip: If three or more agents on the same team miss the same benchmark in the same month, look at lead quality or training first. That’s a system problem, not five individual coaching problems.
Treat it as a recruiting mismatch, not a coaching gap, only when activity is consistently strong but conversion never improves after two full coaching cycles.
How Should Scorecards Guide Hiring and 90-Day Reviews?
Scorecards earn their keep long before an agent’s first closing. Use them at three points:
During hiring conversations, ask candidates to bring their listing-to-sales ratio and average response time from their prior brokerage, if verifiable, these two numbers tell you more than a resume ever will.
In the first 90 days, set ramp targets for activity index and lead-to-appointment rate rather than closings, since closings lag by definition for someone new to the business.
In monthly reviews, run a short agenda: review the data, diagnose the root cause together, agree on two development steps, and set a measurable follow-up date.
Watching the activity index specifically for early-warning dips is one of the most reliable ways to catch disengagement before it becomes a resignation, agents who are quietly checking out almost always slow their follow-up cadence weeks before they say anything.
What Changed When We Started Scoring Leads Weekly?
Nothing else changed. We built the rollout around MyERA Career’s scorecard templates and dashboard views, and the biggest lesson was simple: pilot small, watch the leading numbers weekly, and let the agents see their own dashboard before you ever bring the numbers into a group review.
— Donny
Get the Scorecard Template and Onboarding Support From Myeracareer
Building a scorecard from scratch takes weeks most team leaders don’t have between showings, listing appointments, and recruiting calls. Myeracareer gives you the shortcut: ready-made scorecards, a Sales+ dashboard already mapped to the KPIs above, and a mentorship structure built around the same leading and lagging cadence this article walks through.

Here’s what you get access to when you work with Myeracareer directly:
A scorecard template pre-weighted for response time, conversion, and activity index
Sales+ dashboards that automate first-contact capture instead of relying on manual logs
Onboarding frameworks with 90-day ramp targets built in for new agents
Leadership support for team leaders managing recruiting, coaching, and retention at the same time
If you’re bringing on new agents, the New Agents program walks candidates through RES exam guidance, CEA licensing steps, and a 90-day ramp plan tied to the metrics above. If you’re already leading a team and want a managed partnership with dashboards and mentoring frameworks built in, the Experienced Team Leaders program is the direct next step. Reach out to pilot a scorecard with a small cohort before rolling it out agency-wide.
Sources
For deeper benchmarks, see RobinFlow’s seven-KPI breakdown and EffectiveAgents on transaction-level performance metrics. For recruiting depth, read C3 Dynamic Solutions on brokerage talent acquisition.
Recommended
Comments